


This is a guest post by Andrew Martin, who served as the Chief Data Officer for the Newark Public Schools from 2017-18. Prior to working for NPS he was the Director of Special Projects for KIPP New Jersey, leading research, evaluation, and assessment efforts. He is a graduate of the University of Chicago and a former classroom teacher for KIPP NJ and the New York City Department of Education.
Last year, test scores for Newark Public Schools (NPS) students rose for the third consecutive year. NPS’s 4-year college matriculation rate rose by two percentage points, setting an all-time high for the district. African-American students in Newark are now three times more likely to attend a public school with test scores at or above the state average, 300 percent higher than they were in 2009. In addition, Newark posted the absolute best results for any city in the national PARCC consortium for educating low-income students in math. In 2018, the district graduated more than 2,000 12th grade students – 125 more than the prior year and the highest absolute number of graduates in five years.
You’d be forgiven if these positive statistics about Newark come as a surprise – there are few stories in education where, in the words of US Senator Cory Booker, there is “such a disconnect between a popular understanding and the data.” (A recent piece in the Economist is a notable exception). With no easily-accessible longitudinal data available from the state and a fleeting moment of national attention in the wake of the 2010 Zuckerberg gift that calcified a narrative that was long on political intrigue but short on data, it is no wonder that the national narrative around Newark’s schools seems to miss the truly remarkable gains that Newark’s students have made in the past decade.
Patrick Wall’s recent coverage of Newark’s 2017-18 results in Chalkbeat fell prey to this trap, cherry-picking numbers from recent performance data to breathlessly proclaim that “years of progress” had “halted.” This badly misses the mark on what actually happened in Newark last year, and over the past ten years of reform in the city.
In 2017-18, the percentage of Newark Public Schools students scoring proficient or higher on the PARCC exam across all tested grades rose in both English Language Arts (ELA) and math, the third consecutive year that scores improved. In ELA, the number of students attaining the highest level of proficiency, Level 5, is up 268 percent since 2014-15, and in math, the number of students attaining level 5 is up 212 percent.
Like the SAT, the bar for proficiency on the PARCC doesn’t change from year to year. The improvements in NPS’s scores mean that thousands more Newark students are now on a path to succeed in college and beyond. According to research from Massachusetts, students who achieve a score of 4 or 5 on PARCC have a nearly 90 percent chance of passing their freshman-year courses at a 4-year university. Relative to the first year of PARCC testing in NJ, there are 3,598 more NPS students who are now academically prepared to be successful in a 4-year college.
That’s literally thousands more Newark students for whom education may yet be ‘the great equalizer’ and a path into a stable, high-paying career.
These are staggering improvements, but they weren’t the only great news in the 2017-18 academic data. The city awarded 2,000 high school diplomas to graduating seniors for the first time in recent history, and the percentage of NPS students matriculating directly to a 4-year college rose to 36 percent, the highest rate in the city’s history. (Enrollment at two-year universities declined, likely related to the turmoil and uncertainty created by Essex County College’s near brush with de-accreditation.)
Naysayers may try to explain away Newark’s gains by comparing them to other districts in the state but, in truth, Newark’s improvements are unprecedented — only 18 percent of districts in the state saw 3 years of consecutive gains in both ELA and math, and only 5 percent of districts saw consecutive gains in both ELA and math for African-American students. Newark Public Schools (along with Newark’s TEAM Academy Charter network) was one of an elite group of 18 districts (less than 3 percent of the districts in the state) that saw 3 years of consecutive gains both for all students tested and for African American students.
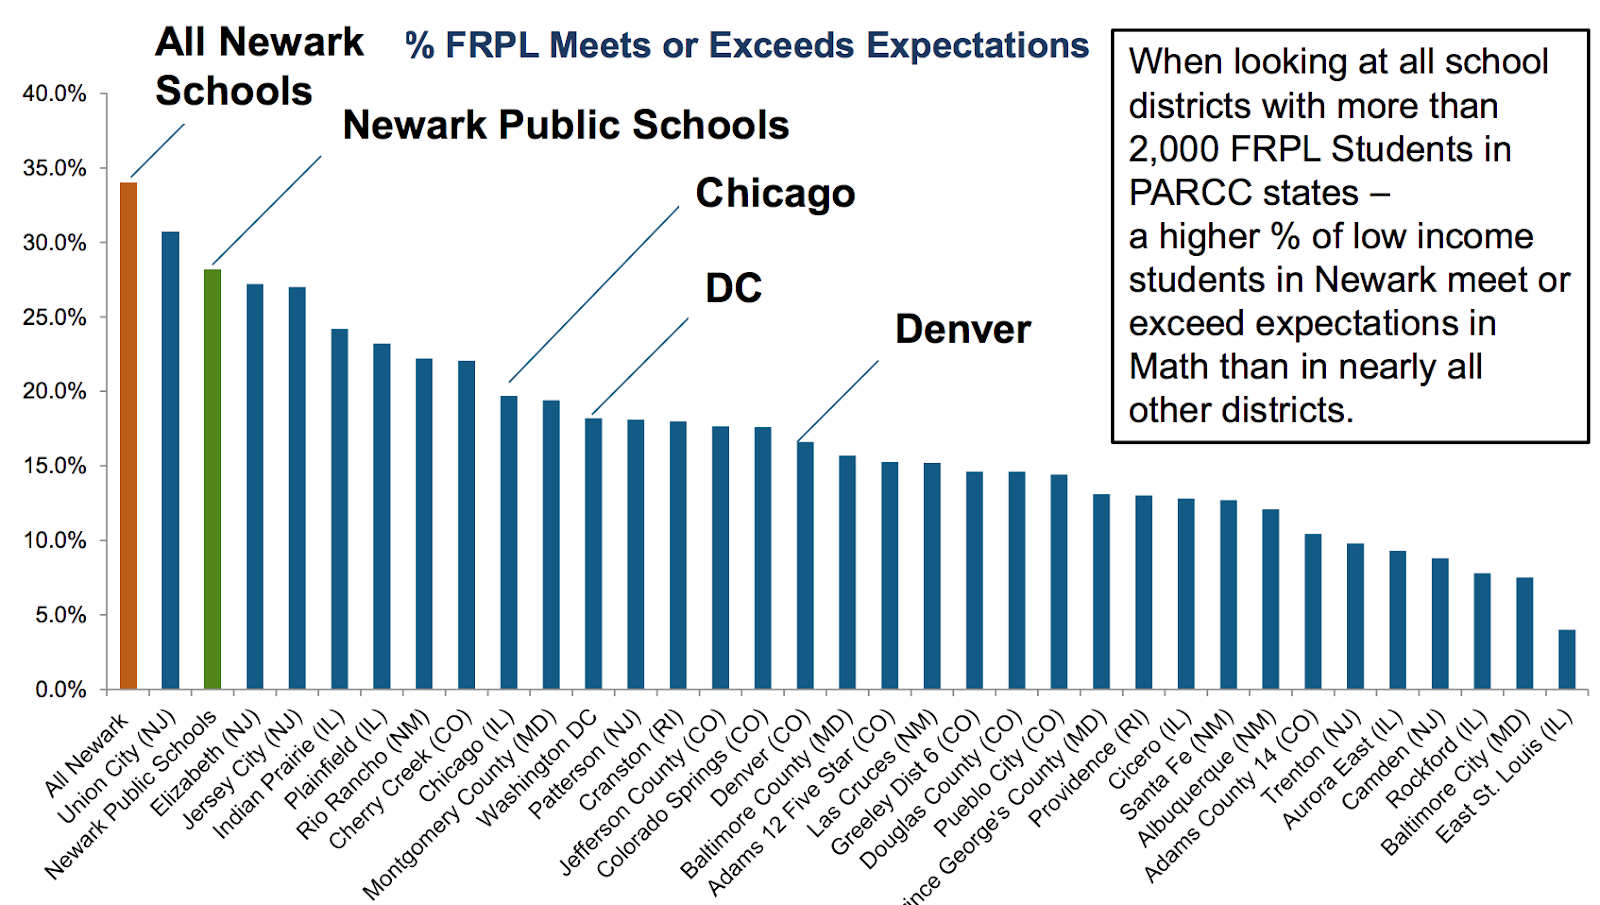
Comparative data taken from the national PARCC consortium underscores this success, showing that Newark Public Schools ranks second only to Union City in achievement for low-income students in math. When Newark’s district and public charter schools are pooled into an all-city aggregate, Newark’s students lead the nation by a wide margin.
These staggering numbers are nowhere to be found in the Chalkbeat story, which downplays test score gains, badly misinterprets growth data, and grabs at anything with a negative sign to argue that the “Newark Public Schools backtracked on a number of key performance measures last school year,” citing college readiness and graduation rate as evidence. Do these “disappointing numbers bolster [the] argument that dramatic changes are needed?” Are these really “darts that U.S. Sen. Cory Booker, the former Newark mayor now running for president, will have to dodge”? Do they really “complicate efforts by the architects [of previous reforms] to claim victory?”
As a former staffer of the district who was involved in these reforms, I’m not without a dog in this fight. But I’ve also spent more time looking at Newark’s performance data than practically anyone out there, and I found Chalkbeat’s framing of the data overheated and misleading.
Let’s talk about some of the specific claims that Wall makes in more detail.
Graduation Rate
The graduation rate numbers that were recently reported out show a decline of 2.8 percentage points, from 78 percent to 76 percent. What to make of this decline? Chalkbeat’s coverage pointed to two competing explanations. The first, quite simply, is that a smaller share of the 12th grade class graduated in 2018. The second is that “data snafus” explain the drop in graduation rate — namely, a breakdown in the “verified transfer” process through which students are dropped from the cohort if they move out of state or out of the country. The available data suggests that issues with reporting, not a change in underlying graduation numbers, best explains the change.
In a press release the district issued at the end of June, shortly before the transition from Interim Superintendent Gregory to current Superintendent Leon, the district cited internal numbers that were “trending toward a record graduation rate.” The memo went on to cite hard and fast numbers, noting that the district projected 2,026 graduates in 2018, an enormous increase over the 2017 graduate number (1,878). So how many students actually graduated? Two thousand and two, according to state data — within 1 percent of the district’s June projection, an improvement of 124 students from the prior year, and a historic milestone (2,000 total graduates) for the district.
So if NPS graduated an additional 124 students, and the district’s June projection was within 1 percent of the estimated total, how, you might ask, did the graduation rate possibly go down? Because the denominator — the total cohort size – went up significantly. In 2017, the graduating cohort was listed as 2,393 students. In 2018, the graduating cohort was listed as 2,645 students.
Do enrollment increases explain the difference? Hardly. If anything, enrollment numbers suggest that the 12th grade cohort was smaller in 2018 than 2017 — charter share of total enrollment has increased steadily over the past few years, and NPS 12th grade enrollment has basically fluctuated around 2000 students for the past five years.
Cohort size is fundamentally a data quality question; it requires thankless data entry work tracking down and inputting transfer paperwork. But there’s no question about what “number of graduates” means – it counts the students who received diplomas from the Newark Public Schools, and the bottom line is that that number reached historic heights in 2018.
But even if one were to discount the most plausible explanation for this modest decline in the graduation rate — i.e., data management issues — Chalkbeat’s reporting almost willfully misses the larger story: Relative to 2011, when a KPMG audit of the district’s graduation records found that the true graduation rate was 55.8 percent, the progress NPS has made in HS completion is truly remarkable.
ACT Tests
Chalkbeat reports that only that “a slightly smaller share” of students passed ACT exams. It is true that ACT averages were down by a point or two on each subject test relative to 2016-17. Does the change in this number signal an actual decline in student achievement among Newark high school students? Even a semblance of fair reporting would state unequivocally that It does not.
The population of students who took the test differed drastically from 2017 to 2018. In 2017, the district participation rate on the ACT was only 39 percent, meaning that only 39 percent of 12th graders sat for the ACT. The participation rate rose to 62 percent in 2018, largely because of shifting practices in graduation pathways. Students graduating from high school in NJ must demonstrate proficiency on the PARCC exam or an equivalent college readiness exam. As a district official noted, “students likely to take the ACT were those struggling to meet the standard via the district provided methods — PARCC and SAT” — which the district offers free of charge to all students. This translates to a lower achieving population” who took the ACT in 2018. In short, ACT performance didn’t go down: Nearly twice as many students (likely biased towards more lower performing students) opted to take the exam to meet graduation requirements.
Median Student Growth Percentile (mSGP)
Wall writes, “In the lower grades, the district’s scores declined in both English and math on a metric that compares student growth to that of peers across the state with similar past scores.” His focus on the year-over-year change in mSGP (rather than the absolute value of the score itself) reflects a fundamental misunderstanding of growth percentiles and their interpretation.
To begin with, Chalkbeat’s year-to-year comparisons of mSGP fail to appreciate that the metric itself requires a comparison of different cohorts of students – since it is based on comparing the performance of students with common levels of academic proficiency across the entire state. In other words, as NPS students improved academically each year, every ensuing year they were measured against a different state-wide cohort, making slight variations in the rate statistically meaningless.
Moreover, growth measures aren’t like proficiency scores – they measure the rate of change. Rates of change aren’t supposed to be a measure of change. Success is the absolute score, not the change from last year. In fact, trying to glean trends from year-to-year changes in growth scores is a particularly poor way to use this data. Growth percentiles exhibit a phenomenon called “mean reversion”: Increases tend to be followed by decreases, and decreases tend to be followed by improvements. In New Jersey, 64 percent of schools who saw an increase in mSGP from 2015 to 2016 saw a decline in mSGP from 2017 to 2018, on average, by 3.4 percentage points. Responsible reporting would note that Newark’s even more modest decline is entirely in line with state-wide norms.
For these reasons, when asked to review Wall’s take on mSGP scores, Bari Erlichson, the former Assistant Commissioner for the NJ Department of Ed, who designed the SGP metric, observed, “there is no statistical difference in Newark’s mSGP change.”
Three years of consecutive gains in PARCC in both ELA and Math. The largest number of 12th grade HS grads, and the highest 4-year college matriculation rate in district history. 3,600 more students achieving at levels that prepare them for college and career. Best achievement results in the nation for educating students living in poverty. “Disappointing darts” that Senator Booker will need to dodge on the campaign trail? Hardly. We should be shouting these results from the rooftop. By virtually any measure of student performance, Newark’s students are headed in the right direction as the city enters a new era of local control.